OpenTelemetry with .NET Core: A definitive guide
OpenTelemetry is a relatively new concept, and I’ve observed that it can be somewhat challenging for beginners to fully understand. While…
OpenTelemetry is a relatively new concept, and I’ve observed that it can be somewhat challenging for beginners to fully understand. While Microsoft and OpenTelemetry offer documentation and tutorials, they only provide a partial view of the broader picture. Many features and configurations remain hidden. In my exploration of OpenTelemetry, I encountered significant frustration in making it work seamlessly with Jaeger. Hence, I’ve decided to share my experience to guide everyone on setting it up and effectively working with it.
Disclaimer: This guide relies strongly on Docker and Docker-Compose. If you are not familiar with them, you can have a look at Docker’s Documentation and Docker Compose documentation. I also try explaining these concept below.
By using Docker, we can easily spin up as many instances of a software as we want and they are completely isolated from each other.
Docker compose works on top of Docker and allows us to set up a set of different software and tear them down easily as a whole. You can also spin up as many set of software as you want without any problems.
What is OpenTelemetry, Otel Collector and how to integrate it with .Net Core app?
“OpenTelemetry is a collection of APIs, SDKs, and tools. Use it to instrument, generate, collect, and export telemetry data (metrics, logs, and traces) to help you analyze your software’s performance and behavior.” In other words, it helps you ease the pain of Observability (Logging, Metric, Tracing).
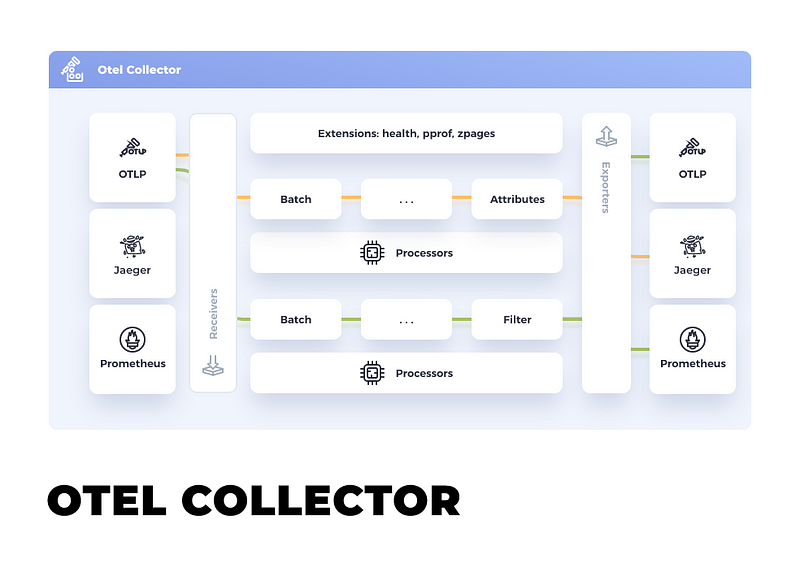
Otel Collector is a piece of software that offers a vendor-agnostic implementation of how to receive, process and export telemetry data. In this article, we’ll transmit telemetry data from our application to the Otlp Collector. The collector will then gather, process, and dispatch this data to various third-party tools like Jaeger, Prometheus, Grafana Loki, providing us with a more insightful representation of our telemetry through interactive UIs, charts, and dashboards…
Setting up the OTLP Collector via Docker is a straightforward process. To begin, let’s create a docker-compose.yaml file with the following contents
services:
  otel-collector:
    image: "otel/opentelemetry-collector-contrib"
    ports:
      - "4317:4317"
      - "55678:55678"
      - "55679:55679"
Afterward, we can execute the container by utilizing docker compose
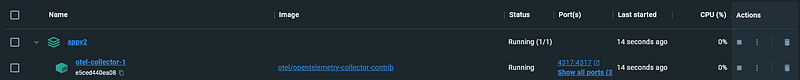
docker compose -p appv1 up -dThe -p option denotes the project name, and the -d instructs Docker to disconnect the output from our terminal
Integrate with .NET Core
We will create a .NET 6 project and install the following packages
<PackageReference Include="OpenTelemetry" Version="1.6.0" />
    <PackageReference Include="OpenTelemetry.AutoInstrumentation" Version="1.1.0" />
    <PackageReference Include="OpenTelemetry.Exporter.Console" Version="1.6.0" />
    <PackageReference Include="OpenTelemetry.Extensions.Hosting" Version="1.6.0" />
    <PackageReference Include="OpenTelemetry.Instrumentation.AspNetCore" Version="1.5.1-beta.1" />
    <PackageReference Include="OpenTelemetry.Instrumentation.Runtime" Version="1.5.1" />
    <PackageReference Include="OpenTelemetry.Instrumentation.Http" Version="1.5.1-beta.1" />
    <PackageReference Include="OpenTelemetry.Exporter.OpenTelemetryProtocol" Version="1.6.0" />
Next, we’ll incorporate this code into the Program.cs file
...
var otel = builder.Services.AddOpenTelemetry();
otel.ConfigureResource(resource => resource
    .AddService(serviceName: builder.Environment.ApplicationName));

// Add Metrics for ASP.NET Core and our custom metrics and export to Prometheus
otel.WithMetrics(metrics => metrics
    // Metrics provider from OpenTelemetry
    .AddAspNetCoreInstrumentation()
    .AddMeter("CustomMeter")
    // Metrics provides by ASP.NET Core in .NET 8
    .AddMeter("Microsoft.AspNetCore.Hosting")
    .AddMeter("Microsoft.AspNetCore.Server.Kestrel"));

otel.WithTracing(tracing =>
{
    tracing.AddAspNetCoreInstrumentation();
    tracing.AddHttpClientInstrumentation();
    tracing.AddSource("CustomActivityName");
    tracing.AddOtlpExporter(otlpOptions =>
     {
         otlpOptions.Endpoint = new Uri("http://localhost:4317/");
     });
    tracing.AddConsoleExporter();
});
...
var app = builder.Build();
...
Now, upon running the application, the console should display output similar to this, indicating that the telemetry is successfully exported to the console
LogRecord.Timestamp:               2023-11-03T16:14:59.2316784Z
LogRecord.CategoryName:            Microsoft.Hosting.Lifetime
LogRecord.Severity:                Info
LogRecord.SeverityText:            Information
LogRecord.Body:                    Now listening on: {address}
LogRecord.Attributes (Key:Value):
    address: http://localhost:5285
    OriginalFormat (a.k.a Body): Now listening on: {address}
LogRecord.EventId:                 14
LogRecord.EventName:               ListeningOnAddress

Resource associated with LogRecord:
service.name: OtlpExample
service.instance.id: 572b7340-bda1-4828-9298-0054fe017383
telemetry.sdk.name: opentelemetry
telemetry.sdk.language: dotnet
telemetry.sdk.version: 1.6.0
If you examine the code we added to Program.cs closely, pay attention to this line.
tracing.AddOtlpExporter(otlpOptions =>
 {
     otlpOptions.Endpoint = new Uri("http://localhost:4317/");
 });
It specifies that we export tracing telemetry to the URI http://localhost:4317/, which is one of the URLs we declared in the Docker Compose file. Let’s check the console of OTLP Collector to see if it prints out anything
If you observe something similar to this, then you can confirm that it’s working.
23-11-03 23:39:58 2023-11-03T16:39:58.788Z    info    ResourceSpans #0
2023-11-03 23:39:58 Resource SchemaURL:
2023-11-03 23:39:58 Resource attributes:
2023-11-03 23:39:58      -> service.name: Str(OtlpExample)
2023-11-03 23:39:58      -> service.instance.id: Str(75add23c-4389-4d95-ae31-e8e35d4466dc)
2023-11-03 23:39:58      -> telemetry.sdk.name: Str(opentelemetry)
2023-11-03 23:39:58      -> telemetry.sdk.language: Str(dotnet)
2023-11-03 23:39:58      -> telemetry.sdk.version: Str(1.6.0)
2023-11-03 23:39:58 ScopeSpans #0
2023-11-03 23:39:58 ScopeSpans SchemaURL:
2023-11-03 23:39:58 InstrumentationScope OpenTelemetry.Instrumentation.AspNetCore 1.0.0.0
2023-11-03 23:39:58 Span #0
2023-11-03 23:39:58     Trace ID       : d3fec9f79ab5550a32a4e2b8fdac214c
2023-11-03 23:39:58     Parent ID      :
2023-11-03 23:39:58     ID             : 3378375d02bf8a24
2023-11-03 23:39:58     Name           : /swagger/index.html
2023-11-03 23:39:58     Kind           : Server
2023-11-03 23:39:58     Start time     : 2023-11-03 16:39:54.7599347 +0000 UTC
2023-11-03 23:39:58     End time       : 2023-11-03 16:39:55.0939759 +0000 UTC
2023-11-03 23:39:58     Status code    : Unset
2023-11-03 23:39:58     Status message :
2023-11-03 23:39:58 Attributes:
2023-11-03 23:39:58      -> net.host.name: Str(localhost)
2023-11-03 23:39:58      -> net.host.port: Int(5285)
2023-11-03 23:39:58      -> http.method: Str(GET)
2023-11-03 23:39:58      -> http.scheme: Str(http)
2023-11-03 23:39:58      -> http.target: Str(/swagger/index.html)
2023-11-03 23:39:58      -> http.url: Str(http://localhost:5285/swagger/index.html)
2023-11-03 23:39:58      -> http.flavor: Str(1.1)
2023-11-03 23:39:58      -> http.user_agent: Str(Mozilla/5.0 (Windows NT 10.0; Win64; x64) AppleWebKit/537.36 (KHTML, like Gecko) Chrome/119.0.0.0 Safari/537.36)
2023-11-03 23:39:58      -> http.status_code: Int(200)
Sending tracing data to Jaeger
Jaeger is a distributed tracing platform released as open source by Uber. With Jaeger you can:
- Monitor and troubleshoot distributed workflows
- Identify performance bottlenecks
- Track down root causes
- Analyze service dependencies
To run Jaeger, simply add it to the docker-compose.yaml file in the services section and modified Otel Collector by adding volumes and depends_on diretive for it. Now, our docker-compose.yaml file looks like this:
services:
  otel-collector:
    image: "otel/opentelemetry-collector-contrib"
    ports:
      - "4317:4317"
      - "55678:55678"
      - "55679:55679"
    volumes:
      - ./otel-collector-config.yaml:/etc/otelcol-contrib/config.yaml
    depends_on:
      - jaeger-all-in-one
  jaeger-all-in-one:
    image: "jaegertracing/all-in-one"
    ports:
      - "6831:6831/udp"
      - "6832:6832/udp"
      - "5778:5778"
      - "16686:16686"
      # - "4317:4317"
      - "4318:4318"
      - "14250:14250"
      - "14268:14268"
      - "14269:14269"
      - "9411:9411"
To transmit tracing data from OTLP Collector to Jaeger, modifications are needed in the otel-contrib.yaml file as well.
receivers:
  otlp:
    protocols:
      grpc:
      http:

processors:
  batch:

exporters:
  logging:
    verbosity: detailed
    tls:
      insecure: true
    default_labels_enabled:
      exporter: false
      job: true
      instance: true
      level: true
  otlp/jaeger:
    endpoint: http://jaeger-all-in-one:4317
    tls:
      insecure: true
service:

  pipelines:
    traces:
      receivers: [otlp]
      exporters: [logging, otlp/jaeger]
  extensions: []
We added the otlp/jaeger to the exporters section and use it in the exporters section of service -> pipelines -> traces -> exporters
Now, if you delete and recreate the appv2 group, you’ll see that Jaeger is up and running in the same network as Otel Collector
docker compose -p appv2 down
docker compose -p appv2 up -d
However, Jaeger is designed for distributed tracing, and it wouldn’t make much sense with just one service. To truly showcase its power, let’s create two more services and illustrate Jaeger’s distributed tracing feature and how it appears on the UI.
Let’s say we create ServiceA and ServiceB using .NET 6, and both of them have the same code in the Program.cs file as mentioned above.
Here’s the plan: we’re going to create an API in our first service. From that API, we’ll make an API call to ServiceA, and from ServiceA, we’ll call ServiceB.
Here’s the code for our initial service. In this API, we’ll make a call to ServiceA.
[HttpGet("chain")]
public async Task<IActionResult> Chain(int number)
{
    var httpClient = _httpClientFactory.CreateClient();
    //for quick demonstration, i hard coded the url here
    var response = await httpClient.GetAsync($"http://localhost:5034/weatherforecast/chain?number={number}");
    if (response.IsSuccessStatusCode)
    {
        return Ok();
    }

    return StatusCode(500);
}
Here’s the code for Service A, which will be invoked from our initial service and will subsequently call Service B.
[HttpGet("chain")]
public async Task<IActionResult> Chain(int number)
{
    var httpClient = _httpClientFactory.CreateClient();
    var response = await httpClient.GetAsync($"http://localhost:5152/weatherforecast/chain?number={number}");
    if (response.IsSuccessStatusCode)
    {
        return Ok();
    }

    return StatusCode(500);
}
The Service B makes an API call to a non-exist endpoint.
[HttpGet("chain")]
public async Task<IActionResult> Chain(int number)
{
var httpClient = _httpClientFactory.CreateClient();
//this endpoint doesn't exist
var response = await httpClient.GetAsync("https://google.com/api/get-something");
if (response.IsSuccessStatusCode)
{
return Ok();
}
return BadRequest();
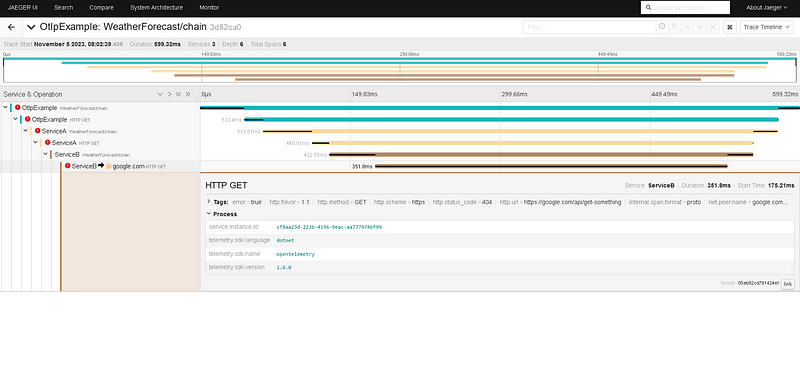
}With our setup complete, invoking the API endpoint in the first service and navigating to the Jaeger UI at http://localhost:16686/ will reveal our services in the dropdown filter. Selecting the first service (OtlpExample in this case) and clicking “Find Traces” will eventually display the traces for the request we invoked earlier.
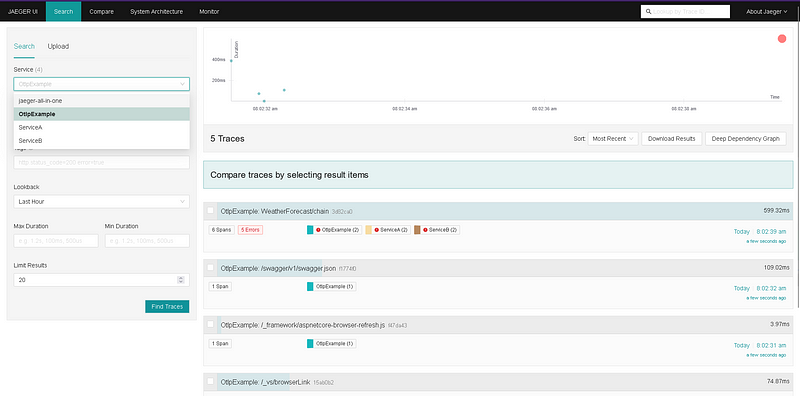
By clicking into the trace, we can see the details of the request. It started with a call to Service A. Inside Service A, there was a call to Service B. Service B then made a call to google.com, which returned a 404 error. This error caused the entire flow to fail.
This is just a simple demonstration of Jaeger’s capabilities. It offers a wide range of features that can be used to monitor and troubleshoot distributed systems. However, we won’t go into detail in this post since we wanted to focus on OpenTelemetry. Hopefully, we will have a more detailed post about Jaeger in the future.
Prometheus
Prometheus collects and stores its metrics as time series data, i.e. metrics information is stored with the timestamp at which it was recorded, alongside optional key-value pairs called labels.
Setting up Prometheus can be a bit more involved than Jaeger. We’ll need to expose an endpoint in our Otel Collector so that Prometheus can scrape the metrics. But first, let’s add Prometheus to our docker-compose.yaml file so we can easily start it up along with the Otel Collector and Jaeger by running the docker-compose up command.
services:
  otel-collector:
    image: "otel/opentelemetry-collector-contrib"
    ports:
      - "4317:4317"
      - "55678:55678"
      - "55679:55679"
      - "9091:9091"
    volumes:
      - ./otel-collector-config.yaml:/etc/otelcol-contrib/config.yaml
    depends_on:
      - jaeger-all-in-one
  jaeger-all-in-one:
    image: "jaegertracing/all-in-one"
    ports:
      - "6831:6831/udp"
      - "6832:6832/udp"
      - "5778:5778"
      - "16686:16686"
      # - "4317:4317"
      - "4318:4318"
      - "14250:14250"
      - "14268:14268"
      - "14269:14269"
      - "9411:9411"
  prometheus:
    image: "prom/prometheus"
    ports:
      - "9090:9090"
    volumes:
      - "./prometheus.yml:/etc/prometheus/prometheus.yml"
Not only do we add Prometheus to our services, but we also export port 9091 of our Otel Collector (for debugging purposes). Additionally, we create a volume to map the configuration file on our machine to the Prometheus instance.
Here’s the content of the prometheus.yml file
global:
  scrape_interval:     1s
  evaluation_interval: 1s

rule_files:
  # - "first.rules"
  # - "second.rules"

scrape_configs:
  - job_name: scrape-app
    static_configs:
      - targets: ['otel-collector:9091']
Basically, we just tell prometheus to scrape metrics at the endpoint ‘otel-collector:9091’, it doesn’t actually scrape data at ‘otel-collector:9091’ but rather ‘otel-collector:9091/metrics’ as default convention.
Next, we’ll need to modify our Otel Collector configuration to enable metric export to Prometheus.
receivers:
  otlp:
    protocols:
      grpc:
      http:

processors:
  batch:

exporters:
  prometheus:
    endpoint: 0.0.0.0:9091
    namespace: test-space
    const_labels:
      foo: bar
    send_timestamps: true
    metric_expiration: 180m
    enable_open_metrics: true
    add_metric_suffixes: false
    resource_to_telemetry_conversion:
      enabled: true
  logging:
    verbosity: detailed
  loki:
    endpoint: http://loki:3100/loki/api/v1/push
    tls:
      insecure: true
    default_labels_enabled:
      exporter: false
      job: true
      instance: true
      level: true
  otlp/jaeger:
    endpoint: http://jaeger-all-in-one:4317
    tls:
      insecure: true
service:

  pipelines:
    traces:
      receivers: [otlp]
      processors: [batch]
      exporters: [logging, otlp/jaeger]
    metrics:
      receivers: [otlp]
      processors: [batch]
      exporters: [logging, prometheus]
  extensions: []
Within the provided configuration, we’ve defined Prometheus within the exporters section and incorporated it into our pipeline
Finally, we need to modify the code in our Program.cs file to incorporate metric instrumentation
otel.WithMetrics(metrics => metrics
    .AddOtlpExporter(config =>
    {
        config.Endpoint = new Uri("http://localhost:4317");
    })
    .AddConsoleExporter()
    .AddRuntimeInstrumentation()
    .AddProcessInstrumentation()
    // Metrics provider from OpenTelemetry
    .AddAspNetCoreInstrumentation()
    .AddHttpClientInstrumentation()
    .AddMeter("CustomMeter")
    // Metrics provides by ASP.NET Core in .NET 8
    .AddMeter("Microsoft.AspNetCore.Hosting")
    .AddMeter("Microsoft.AspNetCore.Server.Kestrel"));
Similar to traces, we send our metrics to the Otel Collector endpoint at http://localhost:4317/. We can also customize the metrics we want to instrument by adding methods after the AddOtlpExporter method.
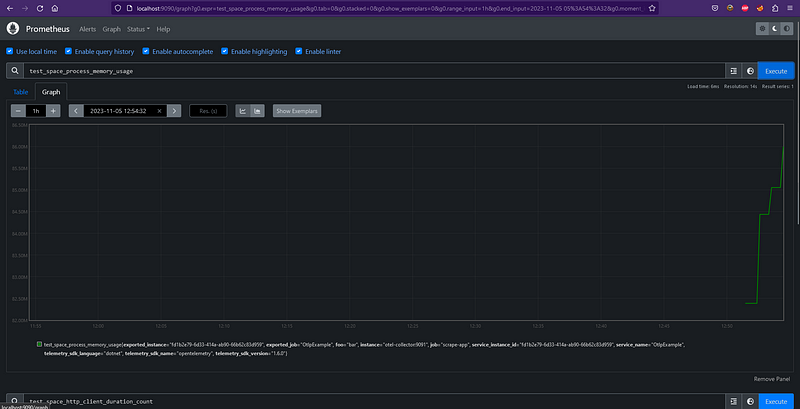
After running our application, invoke the API endpoints and wait for a few seconds. Then, navigate to the Prometheus UI and try querying our data. The data will show up on the graph. The query starts with the ‘test_space’ prefix, which is the namespace we defined in the otel-contrib file above.
Prometheus is no doubt a powerful tool, but its intricacy can make it challenging to grasp on one’s own. While we won’t delve into its depths in this post, we’ll explore its general purpose and provide some pointers for further learning.
Grafana and Loki Logging
Grafana is the famous dashboard. It allows you to Query, visualize, alert on, and understand your data no matter where it’s stored. With Grafana you can create, explore, and share all of your data through beautiful, flexible dashboards.
Loki is a horizontally scalable, highly available, multi-tenant log aggregation system inspired by Prometheus. It is designed to be very cost effective and easy to operate. It does not index the contents of the logs, but rather a set of labels for each log stream.
We will add Grafana and Loki to our docker-compose.yaml file as well.
services:
  otel-collector:
    image: "otel/opentelemetry-collector-contrib"
    ports:
      - "4317:4317"
      - "55678:55678"
      - "55679:55679"
      - "9091:9091"
    volumes:
      - ./otel-collector-config.yaml:/etc/otelcol-contrib/config.yaml
    depends_on:
      - jaeger-all-in-one
  jaeger-all-in-one:
    image: "jaegertracing/all-in-one"
    ports:
      - "6831:6831/udp"
      - "6832:6832/udp"
      - "5778:5778"
      - "16686:16686"
      # - "4317:4317"
      - "4318:4318"
      - "14250:14250"
      - "14268:14268"
      - "14269:14269"
      - "9411:9411"
  prometheus:
    image: "prom/prometheus"
    ports:
      - "9090:9090"
    volumes:
      - "./prometheus.yml:/etc/prometheus/prometheus.yml"
  grafana:
    environment:
      - GF_PATHS_PROVISIONING=/etc/grafana/provisioning
      - GF_AUTH_ANONYMOUS_ENABLED=true
      - GF_AUTH_ANONYMOUS_ORG_ROLE=Admin
    entrypoint:
      - sh
      - -euc
      - |
        mkdir -p /etc/grafana/provisioning/datasources
        cat <<EOF > /etc/grafana/provisioning/datasources/ds.yaml
        apiVersion: 1
        datasources:
        - name: Loki
          type: loki
          access: proxy
          orgId: 1
          url: http://loki:3100
          basicAuth: false
          isDefault: true
          version: 1
          editable: false
        EOF
        /run.sh
    image: grafana/grafana
    ports:
      - "3000:3000"
    depends_on:
      - loki
  loki:
    image: "grafana/loki"
    ports:
      - "3100:3100"
    command: -config.file=/etc/loki/local-config.yaml
To accurately collect and transmit logs to Loki, we must define Loki in the exporters section and integrate it into our pipeline within the otel-contrib.yaml file. This configuration ensures that logs are directed to the appropriate destination.
Before transmitting logs to Loki, the Otel Collector must convert them into its standardized log data model. To accomplish this, we must define the processors attributes and resource for our logs. These attributes provide crucial information about the logs, such as severity level, timestamps, and source location.
OTLP’s log data model plays a critical role in standardizing log data. By standardizing log formats, it enables seamless integration and aggregation of logs from diverse sources, making it easier to analyze and interpret log data effectively.
By implementing these steps, we can effectively collect, process, and standardize logs using Loki and OTLP, ensuring that our log data is well-structured and ready for analysis.
receivers:
  otlp:
    protocols:
      grpc:
      http:

processors:
  batch:
  attributes:
    actions:
      - action: insert
        key: loki.attribute.labels
        value: event.domain

  resource:
    attributes:
      - action: insert
        key: loki.resource.labels
        value: service.name

exporters:
  prometheus:
    endpoint: 0.0.0.0:9091
    namespace: test-space
    const_labels:
      foo: bar
    send_timestamps: true
    metric_expiration: 180m
    enable_open_metrics: true
    add_metric_suffixes: false
    resource_to_telemetry_conversion:
      enabled: true
  logging:
    verbosity: detailed
  loki:
    endpoint: http://loki:3100/loki/api/v1/push
    tls:
      insecure: true
    default_labels_enabled:
      exporter: false
      job: true
      instance: true
      level: true
  otlp/jaeger:
    endpoint: http://jaeger-all-in-one:4317
    tls:
      insecure: true
service:

  pipelines:
    traces:
      receivers: [otlp]
      processors: [batch]
      exporters: [logging, otlp/jaeger]
    metrics:
      receivers: [otlp]
      processors: [batch]
      exporters: [logging, prometheus]
    logs:
      receivers: [otlp]
      processors: [attributes, resource]
      exporters: [loki, logging]
  extensions: []
To complete the log collection process, we’ll need to modify our code to ensure it sends logs to the Otel Collector. This involves incorporating log instrumentation libraries into our codebase.
builder.Logging.AddOpenTelemetry(logging =>
{
    logging.IncludeScopes = true;
    logging.IncludeFormattedMessage = true;

    var resourceBuilder = ResourceBuilder
        .CreateDefault()
        .AddService(builder.Environment.ApplicationName);

    logging.SetResourceBuilder(resourceBuilder)

        // ConsoleExporter is used for demo purpose only.
        // In production environment, ConsoleExporter should be replaced with other exporters (e.g. OTLP Exporter).
        .AddConsoleExporter()
        .AddOtlpExporter();
});
With these steps, we’ve successfully configured Grafana Loki for log aggregation using the Otel Collector. Now, let’s test our setup by adding some logging to our API and invoking it. The logs generated will be sent to the Otel Collector and eventually pushed to Grafana Loki for analysis and visualization.
After that, we can go to Grafana dashboard via the http://localhost:3000 and create a new Dashboard via Dashboard -> New Dashboard, then choose Loki as data source
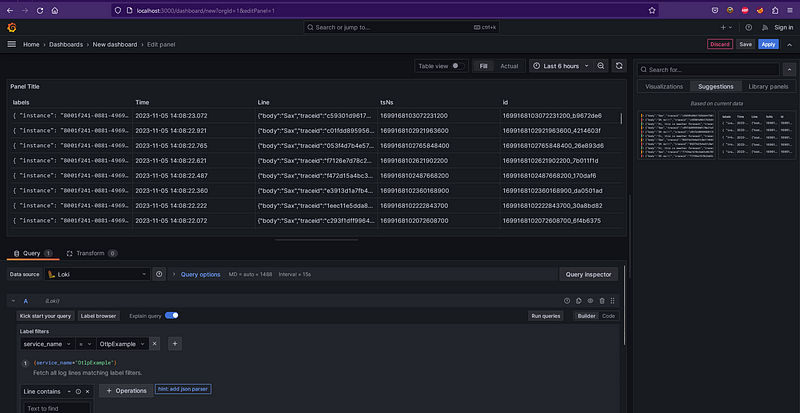
Then, we can use the label filter and choose our service. You can tweak around by querying the logs using the queries and expressions that Grafana provides. Then you can save your dashboard and access the log later via the dashboard.
Conclusion
Even though this is a comprehensive guide, even for those seeking a basic understanding of OpenTelemetry and its integration with tools like Jaeger, Grafana, and Prometheus. I hope this overview has provided a clear understanding of OTLP and its utilization in conjunction with other software tools. I look forward to exploring each software in greater detail in future posts